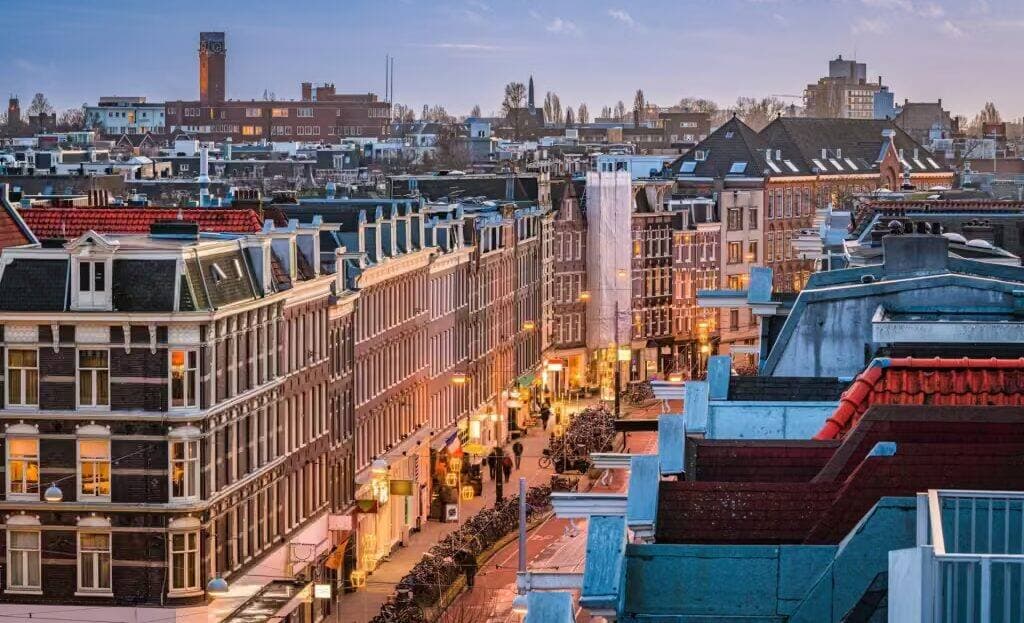
Browse by city
Every Dutch city we track, one tap away from its postcodes.
Four pillars, one composite score
WOZ asset appreciation metrics and localised buyer affordability tiers.
Building era tracking (pre-1970 construction risk flags) and local energy label efficiency spreads.
Population density balances, neighbourhood turnover indexes, and crime/nuisance trend lines.
Registered residential burglary rates and the share of registered crime that's nuisance-type, from Politie Open Data.
Where does this data come from?
We strictly use official, verified public open data provided by the Central Bureau for Statistics (CBS), the Cadaster (Kadaster), the Dutch National Police (Politie), and RIVM (the National Institute for Public Health and the Environment), plus community-mapped amenity data from OpenStreetMap and local permit/zoning notices from Overheid.nl. No commercial bias, no scraped fluff. Just cold, hard civic analytics mapped to your prospective doorstep.

What data or feature is missing that would help you?
We read every response — your feedback directly shapes what we build next.
What data or feature is missing that would help you?
We read every response — your feedback directly shapes what we build next.