Frequently Asked Questions
How fresh is the data?
Core postcode statistics are synced from PDOK's most recent published CBS year. Energy labels are refreshed from RVO's monthly national export. We re-sync periodically as new CBS/RVO data is published.
Why did my neighbourhood score a 40?
A moderate or low score usually means one pillar is pulling the average down — e.g. a lot of pre-1970 construction (Structural) or a high rental share (Social). Open the Structural/Social/Liveability tabs to see exactly which underlying metric is driving it.
Is this official government data?
Yes — postcode statistics and boundaries come from PDOK's CBS Postcode4 API and energy labels from RVO's EP-Online registry, both official Dutch open-data sources. See the Methodology page for details.
Do I need an account?
No. Every report is free and instant, with no login, no email, and no account required.
Why isn't the data from this year or last year?
CBS publishes basic geographic and demographic fields first and fills in detailed metrics — WOZ values, income, healthcare distances, lifestyle counts — much later. We checked: the most recent year has those detail fields 0% populated, and the year after that doesn't exist in the source yet at all. So we intentionally sync from the most recent complete year rather than the most recent published one, and re-check periodically as new years fill in.
Why does Accomodi exist?
Property listings sell you a house — nice photos, a floor plan, a price. They don't tell you about the neighbourhood: rising damp risk in pre-1970 buildings, a shrinking owner-occupied share, or a burglary rate above the national average. Accomodi exists to surface exactly that, using only public data, before you commit to viewing or bidding.
How is Accomodi different from Funda?
Funda (and similar sites) list individual properties for sale — Accomodi doesn't list anything. We're not a marketplace and we don't work with sellers or agents. Every postcode gets the same independent, data-driven Neighbourhood Pulse Score whether or not anything there is currently for sale, so you can research an area before a listing even appears.
Do you sell homes or work with estate agents?
No. Accomodi has no listings, no commissions, and no relationship with sellers or agents — we only aggregate public government data (CBS, PDOK, RVO, Politie, RIVM, Overheid.nl) into one score. That's what keeps the analysis unbiased.
Is Accomodi free to use?
Yes — completely free. Searching a postcode, comparing two areas, browsing cities, and every full report (Safety breakdown included) are all free, with a fair daily usage limit to keep the service sustainable. No account, no email, nothing to unlock.
Which areas does Accomodi cover?
Every Dutch postcode (PC4) that CBS publishes statistics for — effectively the whole country. Some very small or sparsely populated postcodes have certain fields suppressed by CBS for privacy; we show that honestly as "no data" rather than guessing.
Why is there a daily limit on searches and comparisons?
Every lookup costs us real money in data and hosting, and without a cap a handful of bots or scrapers could soak up capacity meant for actual home buyers. 30 free searches and 10 free comparisons a day is far more than anyone doing genuine research needs, and the count resets every night at midnight.
Not sure where to start? Explore the real neighbourhoods below — click any card for the full report.
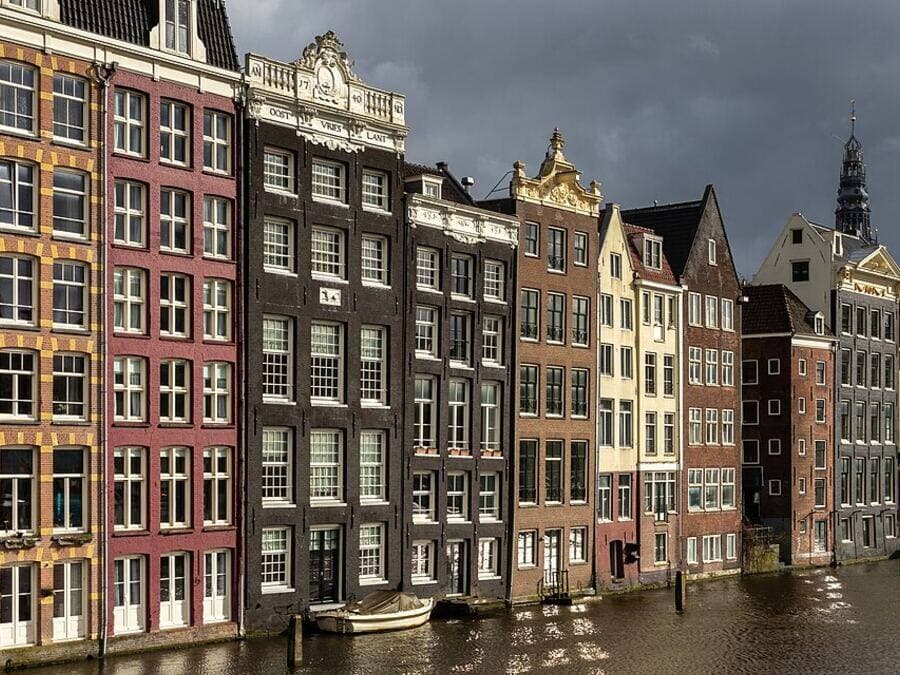
1017 Amsterdam
Historical density of central Amsterdam
79% satisfied with living environment
€946 cost of living/year

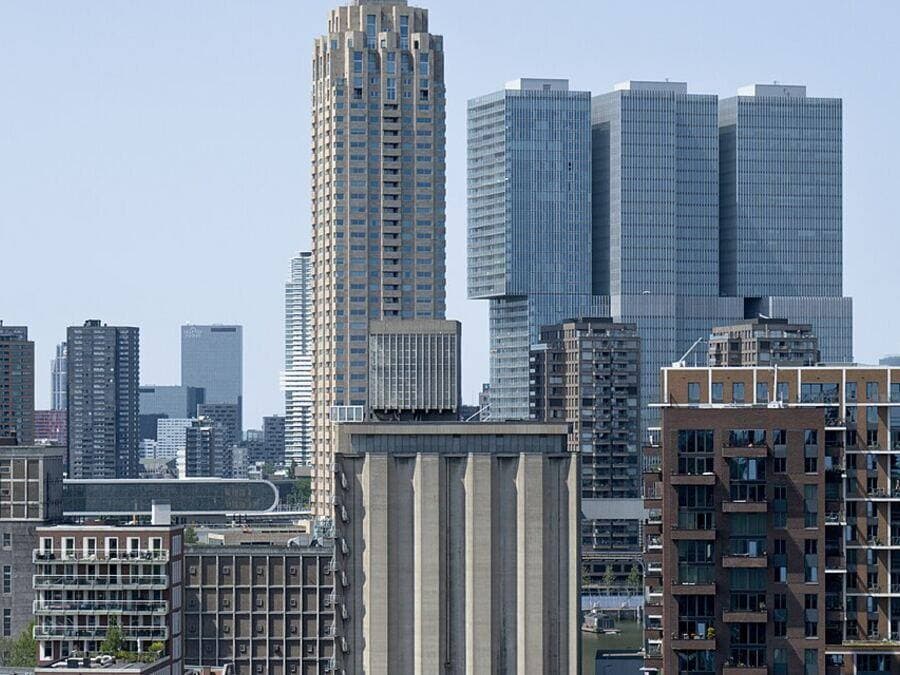
3011 Rotterdam
Modern urban core of Rotterdam
73.3% satisfied with living environment
€1,015 cost of living/year

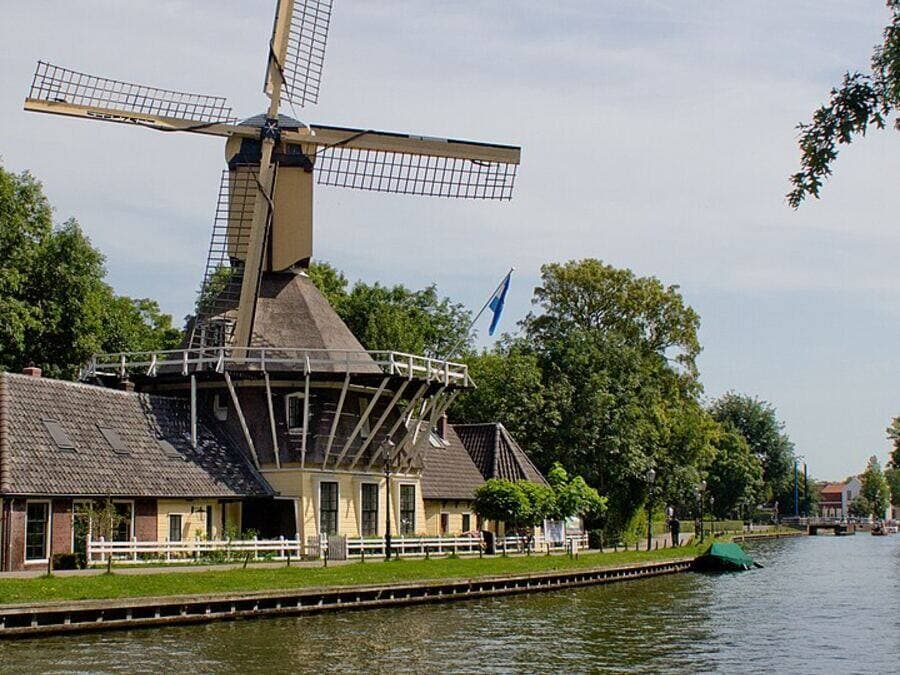
1383 Weesp
Suburban landscape of Weesp
76% satisfied with living environment

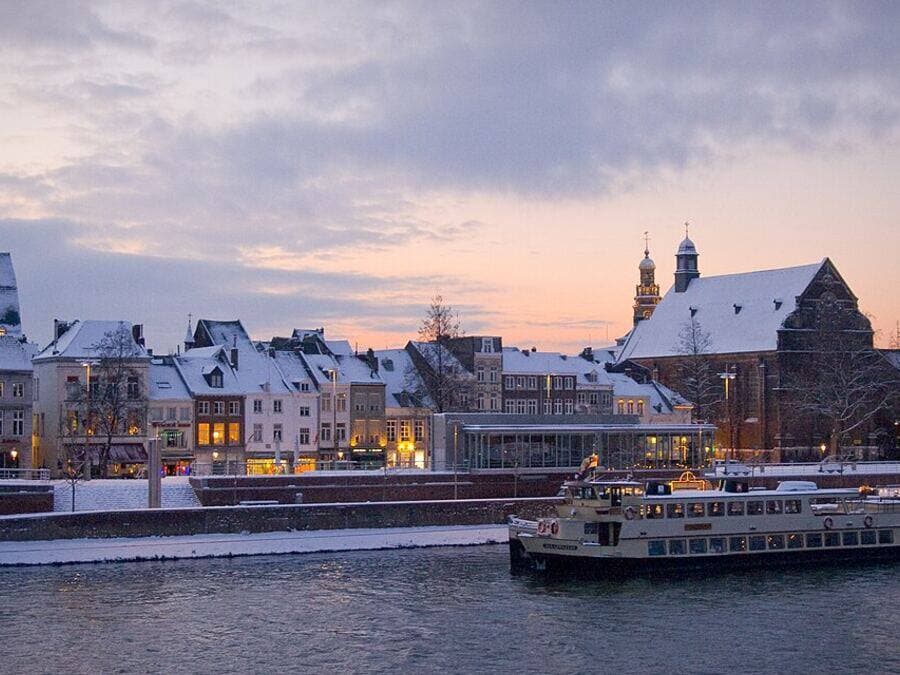
6211 Maastricht
Southern historic heart of Maastricht
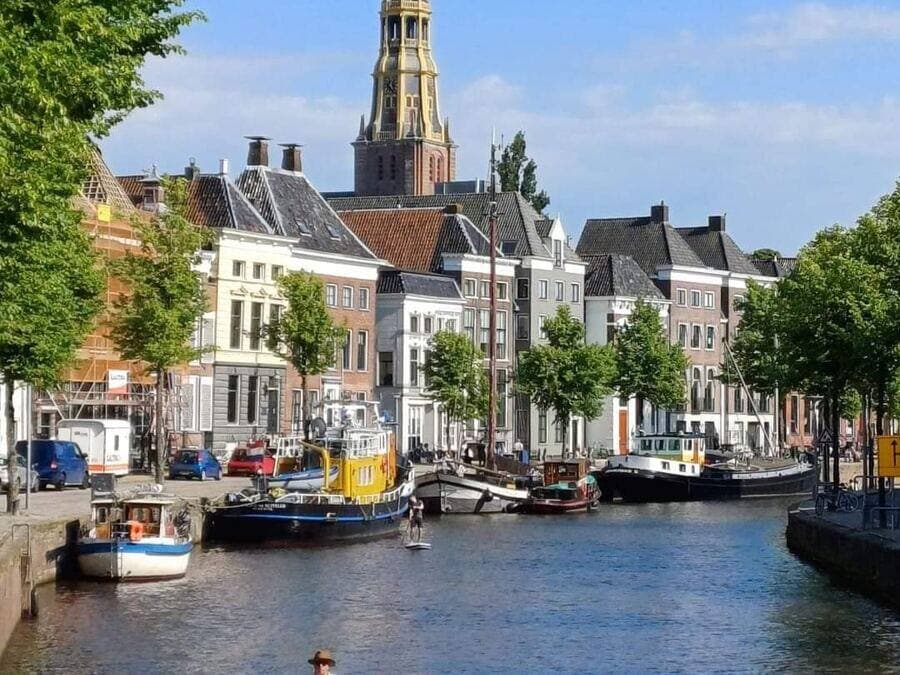
83% satisfied with living environment
€1,045 cost of living/year

9712 Groningen
Northern student vibe of Groningen
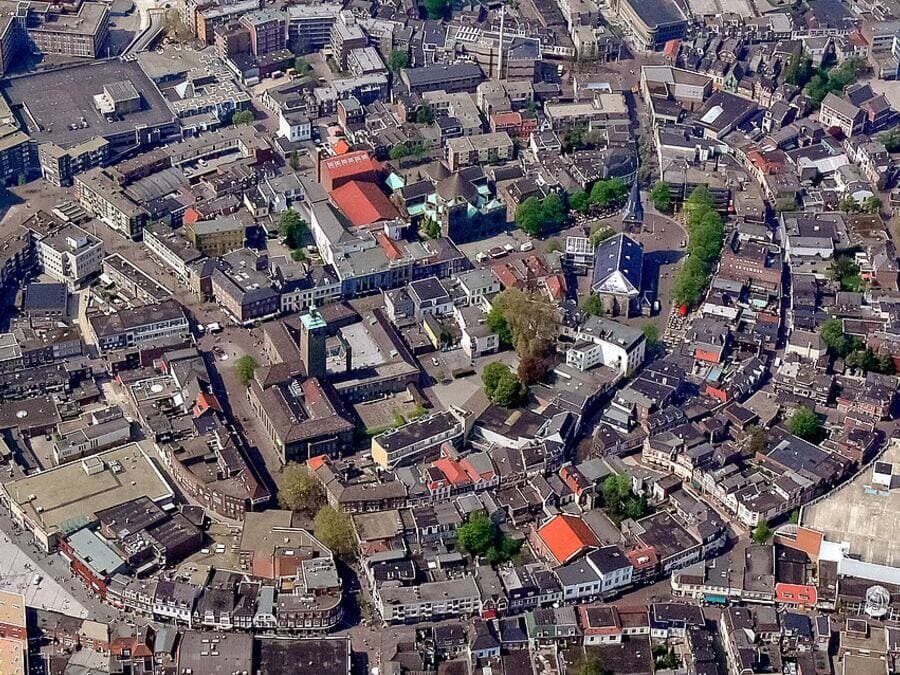
80.7% satisfied with living environment
€1,149 cost of living/year

7511 Enschede
Eastern green innovation of Enschede
77.6% satisfied with living environment

€1,059 cost of living/year
Four pillars, one composite score
WOZ asset appreciation metrics and localised buyer affordability tiers.
Building era tracking (pre-1970 construction risk flags) and local energy label efficiency spreads.
Population density balances, neighbourhood turnover indexes, and crime/nuisance trend lines.
Registered residential burglary rates and the share of registered crime that's nuisance-type, from Politie Open Data.
Where does this data come from?
We strictly use official, verified public open data provided by the Central Bureau for Statistics (CBS), the Cadaster (Kadaster), the Dutch National Police (Politie), RIVM (the National Institute for Public Health and the Environment, including its Atlas Leefomgeving noise survey), and DUO (the Education Executive Agency), plus community-mapped amenity data from OpenStreetMap and local permit/zoning notices from Overheid.nl. No commercial bias, no scraped fluff. Just cold, hard civic analytics mapped to your prospective doorstep.

What data or feature is missing that would help you?
We read every response — your feedback directly shapes what we build next.
Curious about deeper historical trends or price alerts?
What data or feature is missing that would help you?
We read every response — your feedback directly shapes what we build next.
Curious about deeper historical trends or price alerts?