Stop Buying Blind in the Dutch Housing Market.
100% free — no account, no email required
Instantly decode any neighbourhood. Accomodi parses millions of public records across economics, structural quality, and safety data to give you a clear, objective Neighbourhood Pulse Score before you make your largest lifetime investment.
Not sure where to start? Explore the real neighbourhoods below — click any card for the full report.
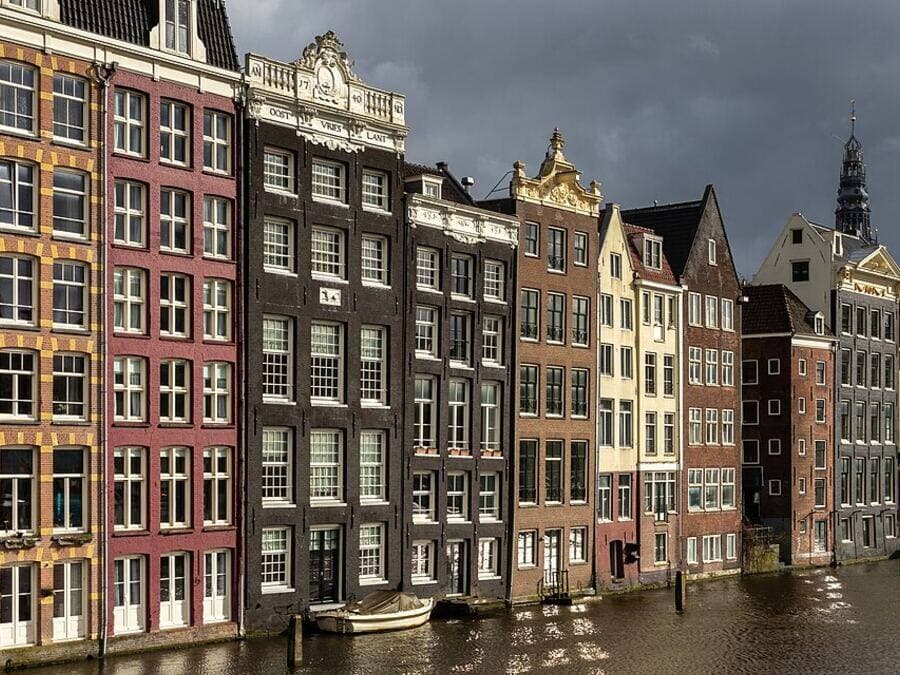
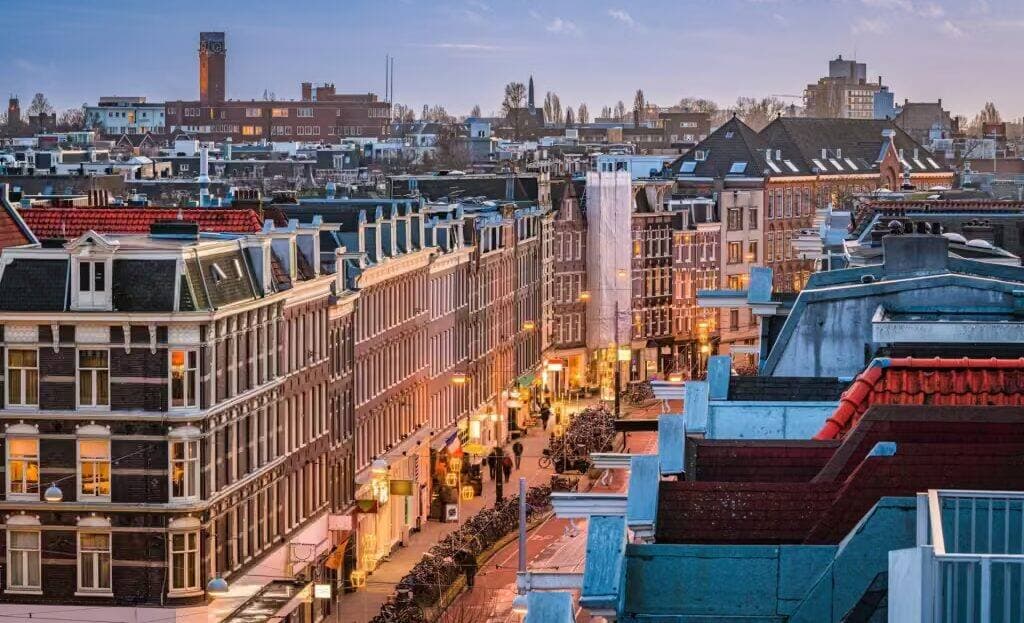
1017 Amsterdam
Historical density of central Amsterdam
79% satisfied with living environment
€946 cost of living/year

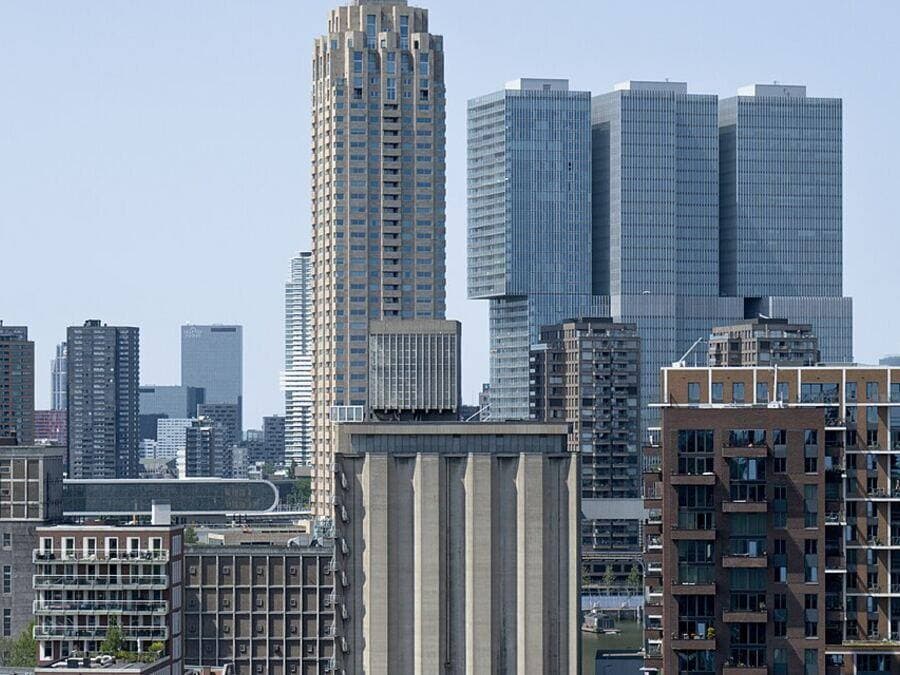
3011 Rotterdam
Modern urban core of Rotterdam
73.3% satisfied with living environment
€1,015 cost of living/year

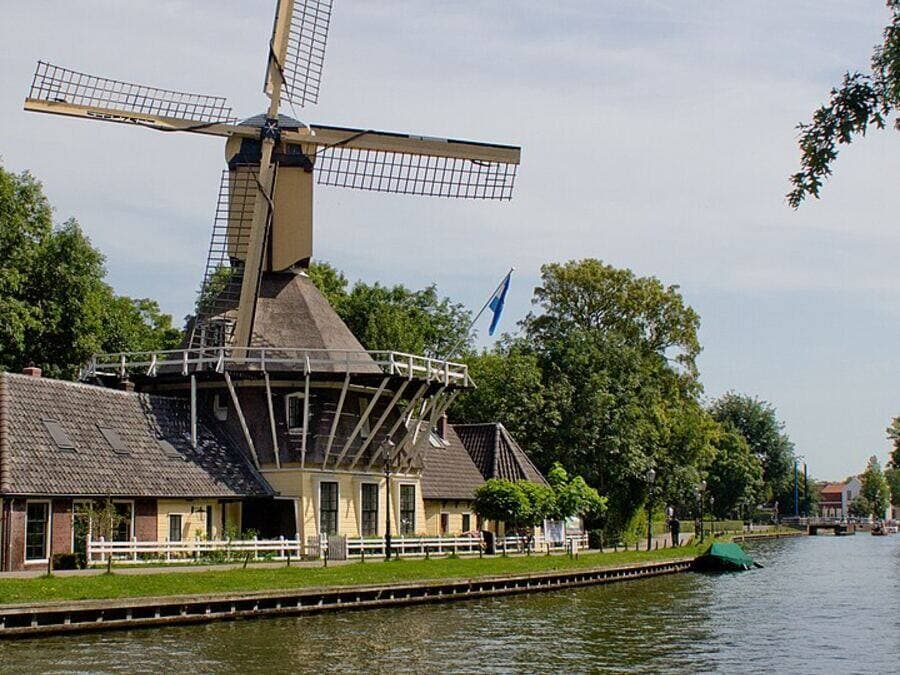
1383 Weesp
Suburban landscape of Weesp
76% satisfied with living environment

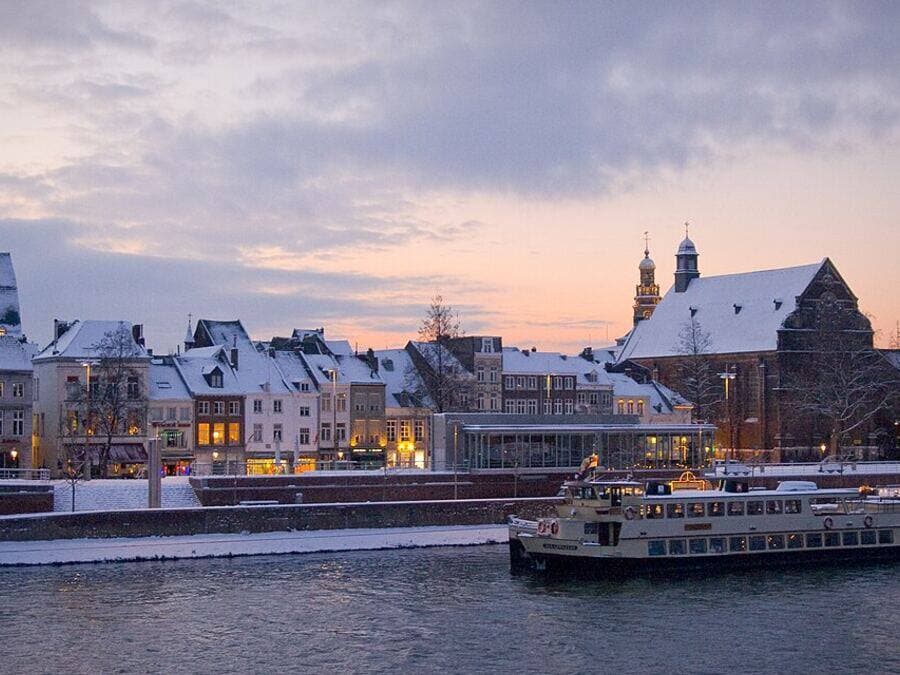
6211 Maastricht
Southern historic heart of Maastricht
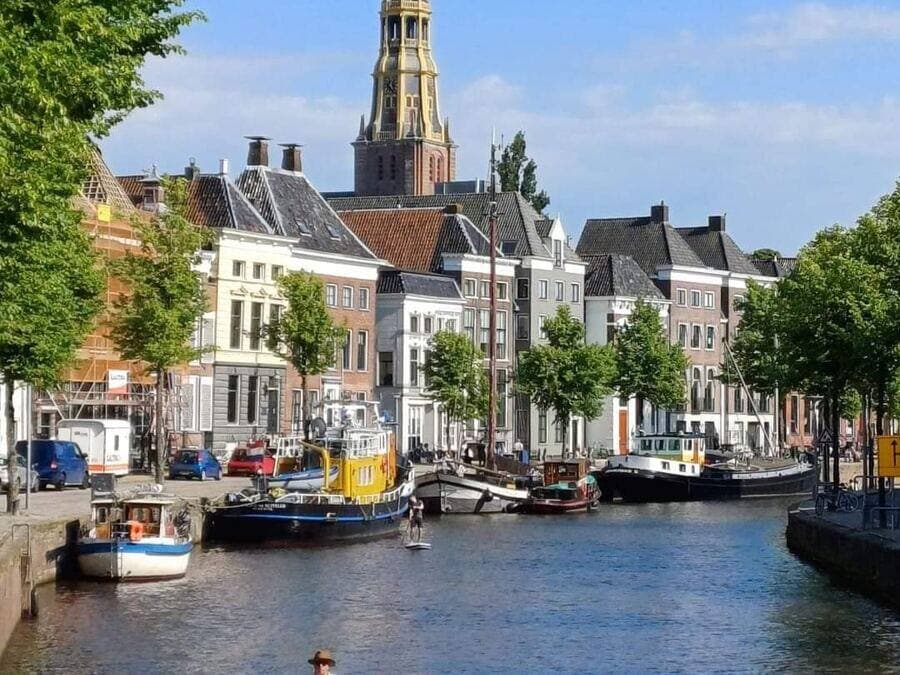
83% satisfied with living environment
€1,045 cost of living/year

9712 Groningen
Northern student vibe of Groningen
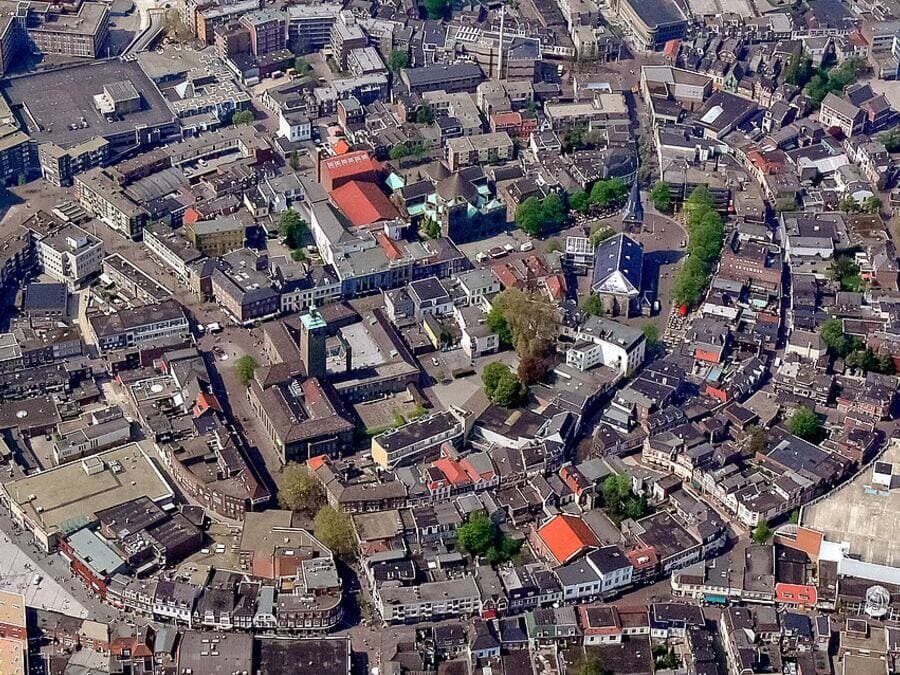
80.7% satisfied with living environment
€1,149 cost of living/year

7511 Enschede
Eastern green innovation of Enschede
77.6% satisfied with living environment
€1,059 cost of living/year
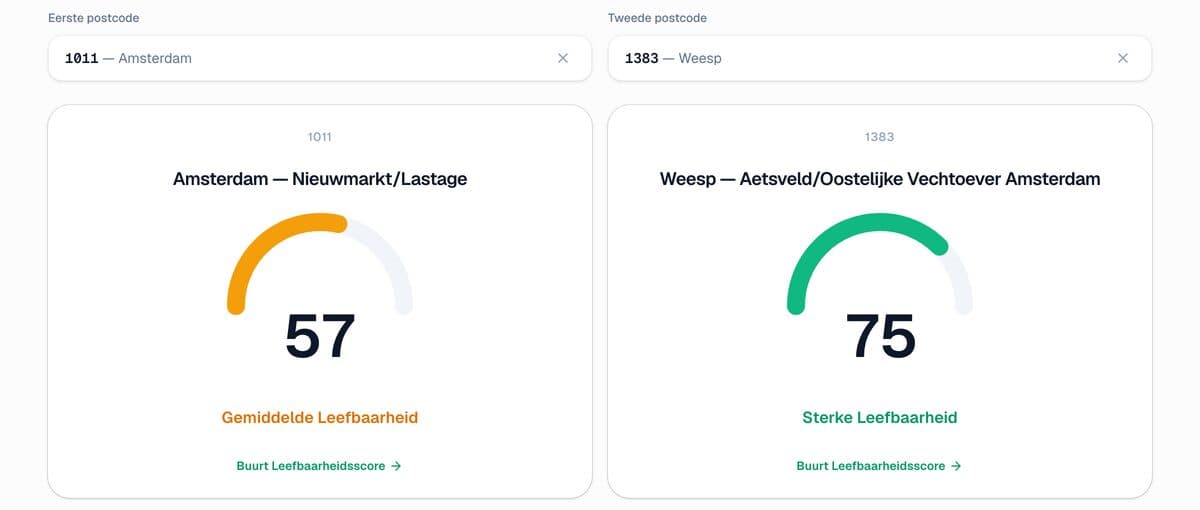
Compare two areas side by side
See two Neighbourhood Pulse Scores next to each other — financial, structural, social, and safety breakdowns included.
Find your ideal neighbourhood
Filter by multiple parameters to see which postcodes match what you're looking for.
Aesthetics show you the house. They hide the neighbourhood.
Buying a home in the Netherlands is highly competitive, especially for locals, expats or buyers moving to a new city. Commercial platforms like Funda show you the aesthetics of a house, but they conceal the neighbourhood realities: hidden foundation risks (funderingsproblemen), shifting demographics, low owner-occupancy rates, or declining historical valuation trajectories compared to national baselines. We don't sell houses, and we don't represent agents. We aggregate open-source government registries into an instantly understandable framework so you can buy with absolute confidence.
Real charts, built from real open data
Every search generates a live dashboard like this — gauges, trend charts, and breakdowns built from official CBS and PDOK data, not stock screenshots.
Age Distribution
Lifestyle & Culture
Four pillars, one composite score
WOZ asset appreciation metrics and localised buyer affordability tiers.
Building era tracking (pre-1970 construction risk flags) and local energy label efficiency spreads.
Population density balances, neighbourhood turnover indexes, and crime/nuisance trend lines.
Registered residential burglary rates and the share of registered crime that's nuisance-type, from Politie Open Data.
Where does this data come from?
We strictly use official, verified public open data provided by the Central Bureau for Statistics (CBS), the Cadaster (Kadaster), the Dutch National Police (Politie), RIVM (the National Institute for Public Health and the Environment, including its Atlas Leefomgeving noise survey), and DUO (the Education Executive Agency), plus community-mapped amenity data from OpenStreetMap and local permit/zoning notices from Overheid.nl. No commercial bias, no scraped fluff. Just cold, hard civic analytics mapped to your prospective doorstep.

What data or feature is missing that would help you?
We read every response — your feedback directly shapes what we build next.
Curious about deeper historical trends or price alerts?
What data or feature is missing that would help you?
We read every response — your feedback directly shapes what we build next.
Curious about deeper historical trends or price alerts?
